
Introduction
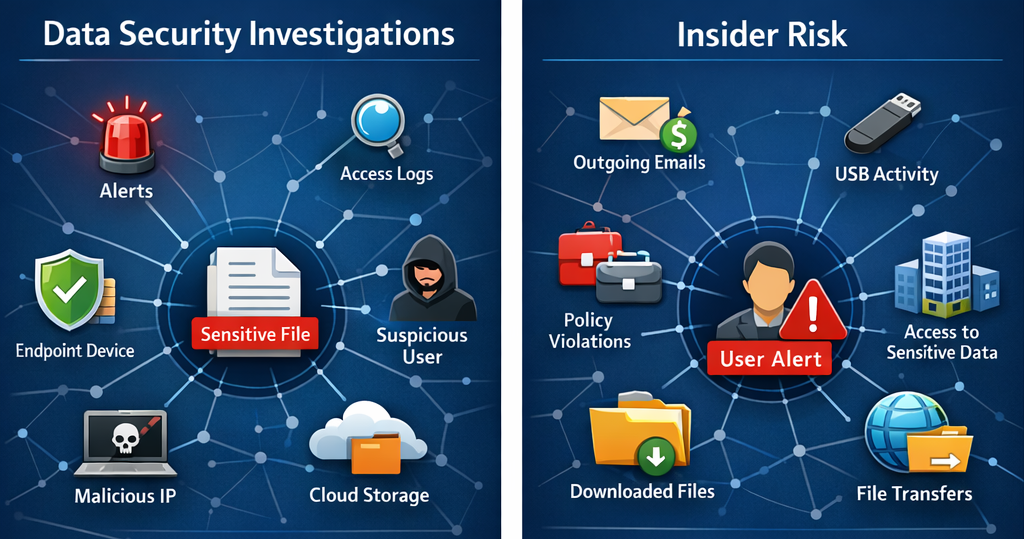
This post is intended for Microsoft 365 security engineers, Purview administrators, and incident responders who need faster, clearer ways to investigate data incidents and understand who interacted with data and how it moved. It focuses on the data risk graph capabilities in Microsoft Purview, particularly Data Security Investigations (DSI) and Insider Risk Management. I will explains how they are powered by Microsoft Sentinel integration and Microsoft Sentinel graph. Furthermore, it includes some operational recommendations as general guidance.
Note:
I covered the topic of Data Security investigations in earlier article on LinkedIn, than can be found here.
Additional insights on embedded AI functionalities in Microsoft Purview can be viewed in this ITuziast article here.
Why a graph changes data incident investigation?
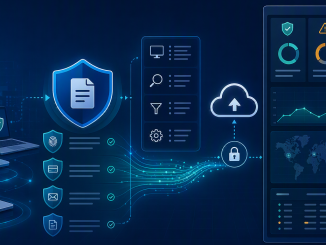
Traditional investigations often rely on timelines and isolated artifacts, such as alerts, audit events, and file lists. Data risk graphs take a different approach by showing how assets, users, and activities connect, making it easier to understand context, assess impact, and explain findings.
Why the graph matters:
- Shows relationships between impacted assets, users, and their actions in a single visual view.
- Helps investigators move beyond raw logs to see context and likely paths of activity.
- Improves communication by making findings easier to explain visually.
Pattern:
Use the graph to answer “What’s connected?” early, then use other tools to answer “What exactly is in the content?” later.
Don’t try to make the graph your only evidence source. Treat it as a context layer that helps you target deeper review. Both Data Security Investigations and Insider Risk Management describe the data risk graph as a visual investigation experience combining asset and activity data into a single view. Powered by Microsoft Sentinel integration, summarizing activity over the past 30 days in their respective contexts.
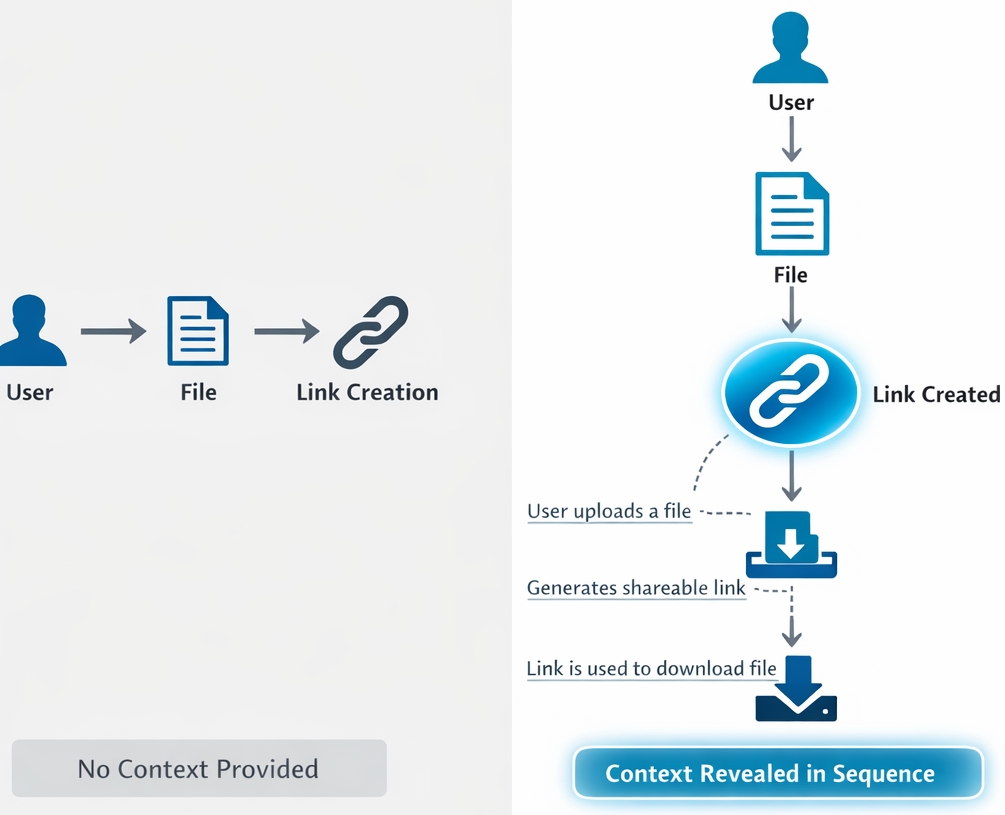
The data risk graph in both Data Security Investigations and Insider Risk Management currently focuses on a defined set of exfiltration-related activities.
Supported activity types
- Anonymous links created/used (SharePoint/OneDrive)
- Company links created (SharePoint/OneDrive)
- File downloads/renamed (SharePoint/OneDrive)
This scope shows the kinds of investigation questions the graph is designed to answer primarily link and download-focused exfiltration patterns. It also helps set expectations by making clear which incident paths the graph does not currently claim to cover.
Pattern:
Use the graph to triage exfiltration hypotheses (links/downloads/renames), and then pivot to investigations and examinations for content impact and remediation.
Expecting the graph to explain every incident path will frustrate You, start from the supported activity set and work outward.
What must be true before graphs work?
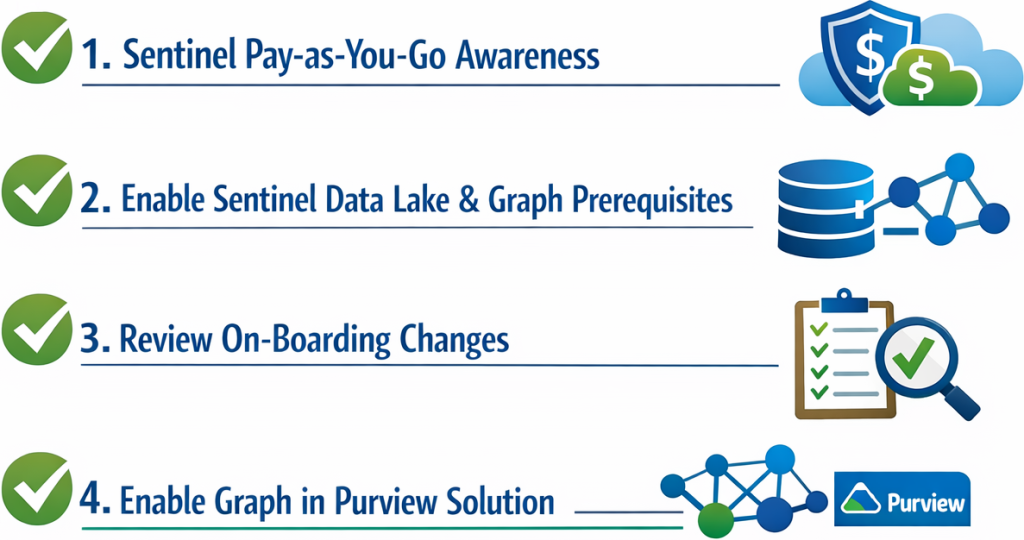
To use either graph experience, you must understand Microsoft Sentinel pay-as-you-go billing, complete the prerequisites for Microsoft Sentinel data lake and Microsoft Sentinel graph, and review the on-boarding changes for connecting to them.
Both experiences also follow an important operational rule: you have only one data lake. If some other service on-boarded it, then Microsoft Purview will use that one.
Pattern:
Treat Sentinel data lake/graph on-boarding as shared infrastructure. On-board once, then reuse across supported Microsoft Purview solutions.
Trying to troubleshoot graph “no data” symptoms without validating Microsoft Sentinel on-boarding prerequisites first leads to wasted cycles.
Critical limitations and “gotchas” that affect real deployments
Both the Data Security Investigations and Insider Risk Management data risk graph pages state that Administrative Units are not supported. If an administrator is scoped to an Administrative Unit, data will not appear in the data risk graph.
This is a deployment-critical limitation. If you use administrative units to delegate administration, scoped admins should expect the graph to appear incomplete or show no data.
The Insider Risk data risk graph page explicitly says you cannot use this feature with anonymized usernames enabled. If usernames are anonymized, the graph will not load. This is a direct tradeoff between privacy configuration and graph utility that must be decided intentionally.
Pattern:
Document graph prerequisites and exclusions (Administrative Units, anonymized usernames), so “no graph data” is recognized as configuration, not a bug.
Data Security Investigations includes risk examinations that explain why items received their risk scores and provide recommended mitigation steps. Microsoft also advises filtering out data that is not relevant so processing stays focused and efficient. How to use this with the graph:
- Use the data risk graph to identify the most relevant evidence, such as the file involved and the user interactions around it.
- Use risk examinations to interpret that evidence more deeply and frame the appropriate mitigation response.
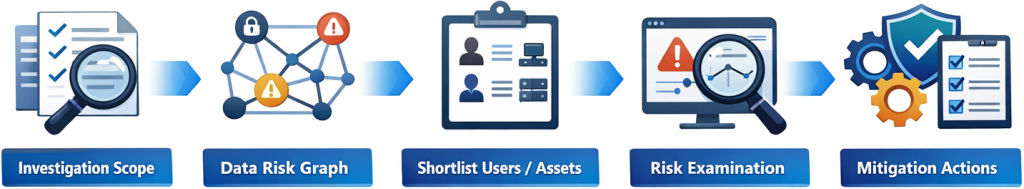
Pattern:
Graph first for “relationship triage”, examinations next for “risk reasoning”, and only then decide mitigation steps.
Jumping straight to remediation without understanding the relationship context (who shared, who downloaded, which link type) increases false positives and disruption.
Conclusion
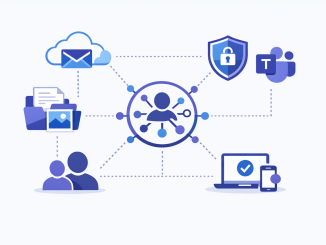
Data risk graphs bring relationship-first investigation to Purview by connecting files, users, and exfiltration activity into a single visual view, powered by Microsoft Sentinel graph.
They work best for triaging supported exfiltration patterns in SharePoint/OneDrive, such as links, downloads, and renames. Furthermore, they should be paired with deeper investigation tools for risk assessment and mitigation.
Success also depends on correct Sentinel data lake and graph on-boarding, along with a clear understanding of key limitations, especially administrative unit scoping and anonymized usernames in Insider Risk.
If you’re already pursuing a unified SecOps model, treating Sentinel graph as shared analytics infrastructure helps avoid siloed investigation tooling.

Be the first to comment