
In March last year, I did an overview of the new Connection Monitor capabilities (check the following link). Since then Microsoft team published the service in production.
Besides the rebranding of Connection Monitor (public preview), and swapping with the old one – Connection Monitor (classic) there are certain functional capabilities, introduced in the release. In that context, the pricing of the service itself, is also announced.
What has changed?
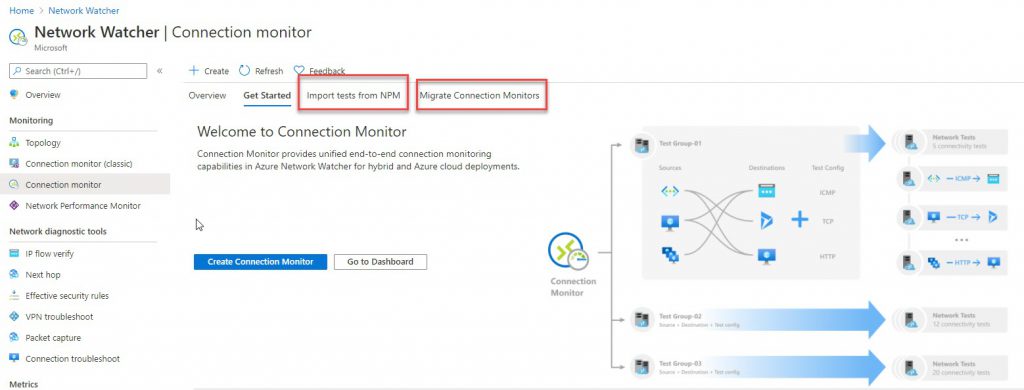
Since the Public Preview, some functionalities were amended, and some are new. The tool aims at end-to-end connection monitoring. Still, the main usage scenario relates either to a virtual machine, with focus on endpoints in Azure, other cloud providers, on-premises environment. They have improved the detection capabilities in hybrid deployments, and it tightly integrates with Log Analytics for historical data keeping.
These enhanced capabilities provide better visualization and analysis capabilities between these three worlds.
Since the feature is out of preview, this means charges will apply to ones that already use the service or plan to use it. Corresponding charges for logs ingested and metric or log-based alerts created to the Azure Log Analytics service will be additional to these.
Each month, 10 tests are included free of charge. And then the following charges apply:
| Number of tests | Price per test/ per month |
| 10 – 240,010 | 0.30 USD |
| 240,010 – 750,010 | 0.1 USD |
| 750,010 – 1,000,010 | 0.005 USD |
| 1,000,010+ | 0.002 USD |
For more details check out this link. For calculations regarding the costs, go to the Azure Calculator.
Migrating the service
If you already used the Network Performance Monitor, the migration is seamless without any downtime. Migration process will produce the following results:
- In case you have on-premises agents and firewall settings, there is no change. Log Analytics agents need to be replaced with Network Watcher extensions.
- Any existing test is mapped to the specific Test format. You can either edit the properties of the new connection or download the template. After you make the changes, you can submit the template via Resource Manager.
- Agents send data to Log analytics and metrics at the same time.
Migration can be done either by importing from Network Performance Monitor or from Connector Monitor (Classic).
For the migration to be successful, you need to make sure that Network Watcher is enabled in your subscription and the region of the Log Analytics workspace and that agents installed on the virtual machines are enabled with the Network Watcher.
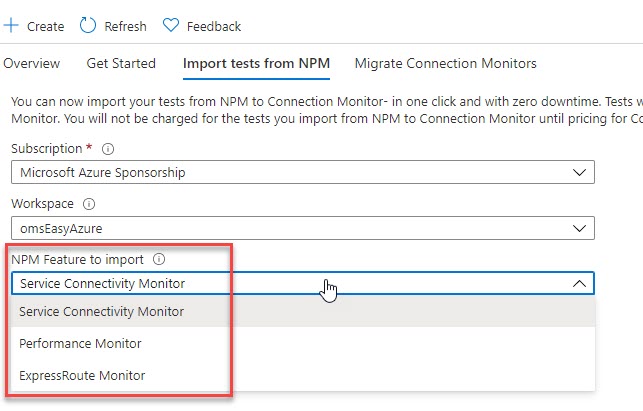
Import tests from Network Performance Monitor (NPM)
This is a one click, zero-downtime process. In addition to that, the migration will not delete the tests from NPM. You can continue to check connectivity in NPM UI, Log Analytics workspace and Connection Monitor. Just be mindful of the charges, and as soon as you do the migration, perform clean-up if necessary.
In the initial step of the migration, you need to choose with feature of NPM you are migrating. You have the Service connectivity, Performance, or ExpressRoute monitor. Each test needs to be imported individually.
The import process is short and fast. As far as the data monitoring goes, there are some changes.
New connector monitor is created, per region and subscription. If any on-premises test exists, the new name is formatted as <workspaceName>_”on-premises”, and for Azure agents the new name is formatted as <workspaceName>_<Azure_region_name>.
Test names are carried forward as test group name, but without description (you will need to re-enter it). For on-premises machines, all source and destination endpoints are created in the new test group. The new name format is <workspaceName>_”endpoint”_<FQDN of on-premises machine>. For Azure machines, in case agents are not running, first enable them and then run the migration.
For data stored in Log Analytics, after the migration it will stay in workspace where NPM is configured (NetworkMonitoring table). Once migration completes, the data will go to both old and newly created table – ConnectionMonitor_CL.
When you do the clean-up process, afterwards, only the new table will be used to store data. For the cleanup, you will need to manually disable all tests in NPM. If not, charges will still occur.
For Log based alerts, dashboards and (if any) third party integrations (i.e. Grafana, Power BI, SIEM tools, etc), each query must be manually edited with reference to the new table (ConnectionMonitor_CL). To re-cerate alerts in metric, see following article.
Migrate to Connection Monitor from Connection Monitor (Classic)
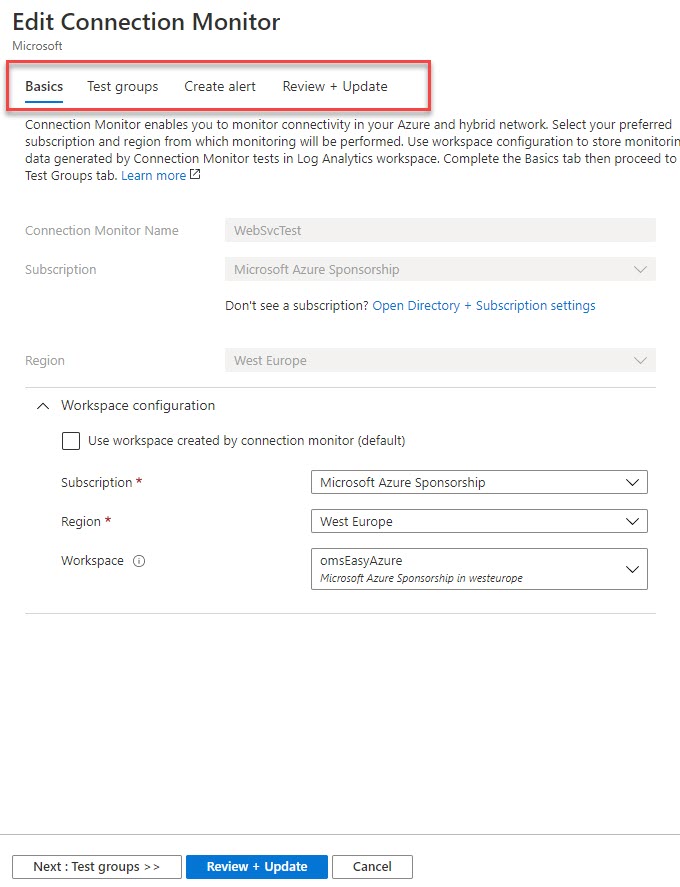
Migrating older connection monitors to the newer one, is also few-clicks, zero-downtime process. Some changes will occur. There are couple of things you can do, in regards of default workspace, properties, or download the template.
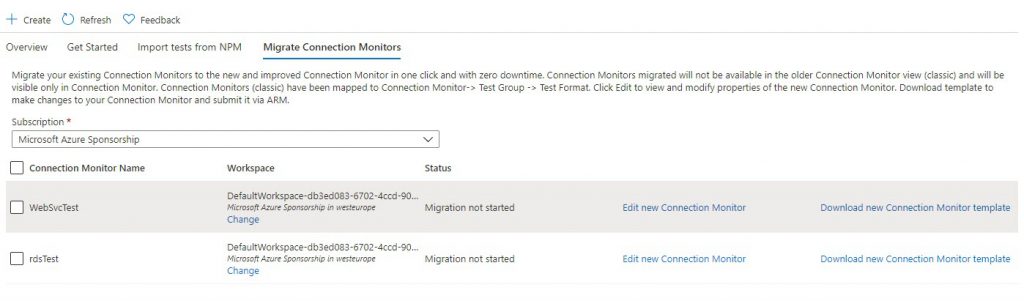
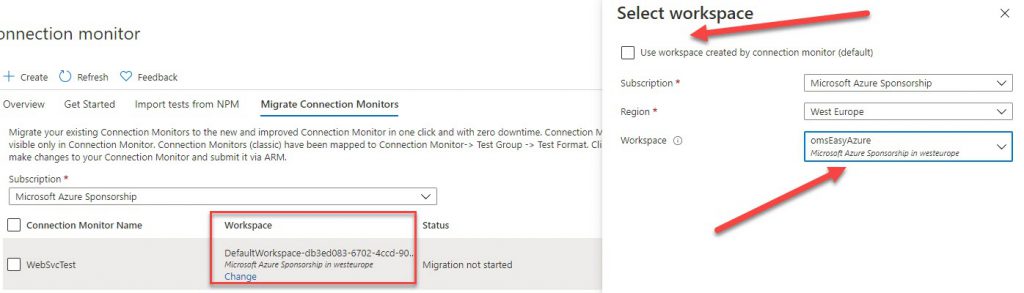
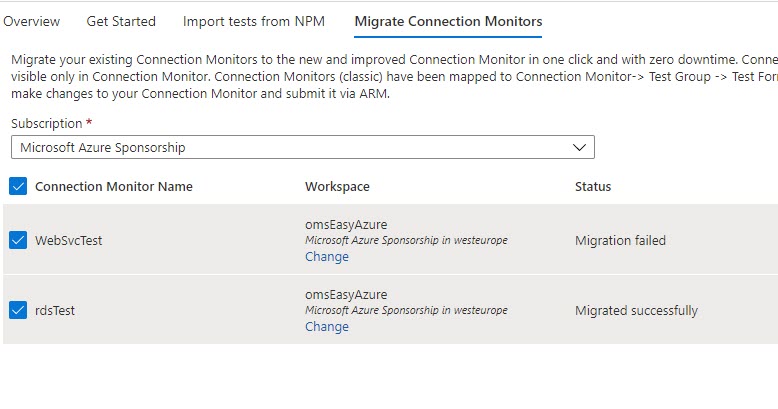
For this specific scenario, I have, decided to move both WebSvcTest and rdsTest, from the generic workspace, and move the connection monitor to my centralized workspace (omsEasyAzure). If the connection monitor is not customized, default workspace will be created. All data will be stored there.
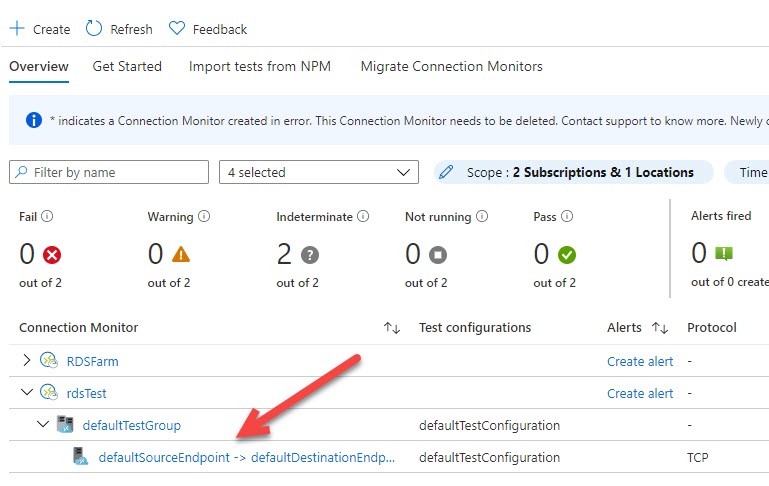
Each test that is migrated, will be placed in defaultTestGroup. This will affect the naming of the source and destination endpoints, and their names will be defaultSourceEndpoint and defaultDestinationEndpoint. The destination port and probing interval are moved to a test configuration called defaultTestConfiguration (this cannot be changed). The protocol is set based on the port values. Success thresholds and other optional properties are left blank.
If failure occurs, you can check the Activity Log for more details (i.e. the VM is stopped or removed),
As far as editing the properties goes, you cannot change the name, subscription, and region, which is understandable. On the other hand, you can modify/append the test groups, as well as alert rules. Renaming of the source and destination points, or the test group name can be done after migration process.
Once I did the migration, with little bit of naming tweaks, some update on the test process, and throwing new test configuration (due to name change). I was up and running in no time.
In either way, the editable options are the same, no need to do clean-up after migration. The only manual process that is part of this experience is any third-party integration (Grafana, SIEM tools, Power BI).
Conclusion
Microsoft has really streamlined the process of migration for us. We just need to be careful with the potential “hidden” costs during NPM import process.
Make sure that all workloads are up and running. Furthermore, that no pending issues exist with the service, prior to migration.
I must say, the pricing calculator seems little bit of confusing. On the other hand, Microsoft’s licensing/pricing clutter is not something new.


Be the first to comment