
Guest Health monitoring (Public Preview), part of Azure Monitor, allows you to monitor the health of Your virtual machines. The performance data is being collected, in regular intervals, from the guest operating systems. You can review the data or get alerts.
More info: Guest Health feature in Azure
Where to start with guest health monitoring?
As part of the Azure Monitor service, all aggregated data must reside in Log Analytics workspace. Prerequisites are:
- Virtual machines are on-boarded in Azure Monitor
- User preforming this action, must have at least Contributor level (RBAC) to the subscription
- Microsoft.WorkloadMonitor and Microsoft.Insights
You should be aware, that the current Public Preview was certain limitations:
- It supports only Azure virtual machines within specific regions (worldwide)
- Supported operating systems: Windows Server 2012+ or Ubuntu 16.04/18.04 LTS
- Log analytics workspace must be in East US, East US Early Updates Access Program (EUAP) or West Europe
More info: Guest Health monitoring current limitations
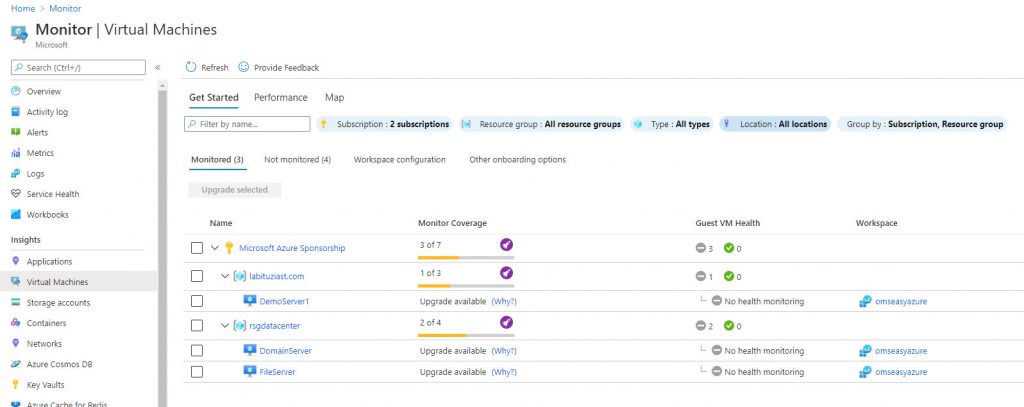
On-boarding virtual machines for health monitoring
There are three steps, as part of the on-boarding of virtual machines:
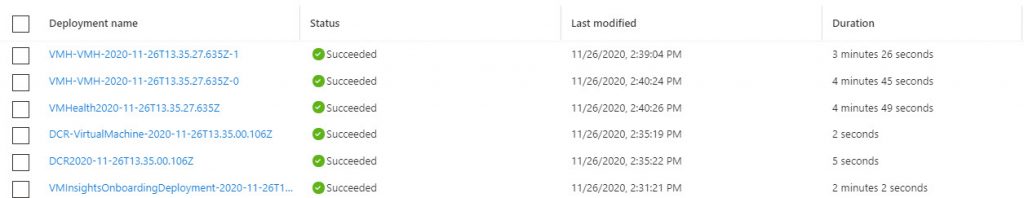
- Create Data Collection Rule (DCR)
- Install appropriate guest health extension
- Create association between the virtual machine and the rule (DCR)
By using the Azure portal, all required configuration is done for you.
For machines connected to Log analytics workspace, you can perform Upgrade of the agent. After that, you can initiate the process.
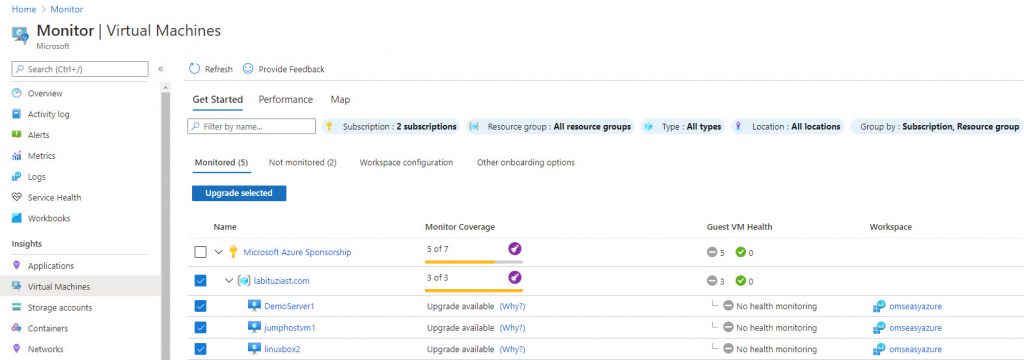
You can select individual virtual machines, as well. You need to go to Monitoring blade, select Insights, and then Enable the agent.
On unsupported operating systems, the agent can’t be installed or upgraded.
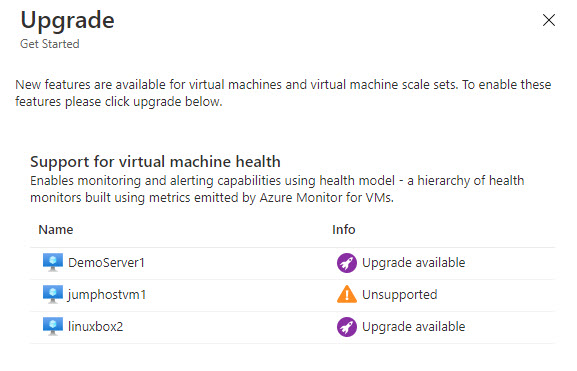
The installation of the agents takes some time (5-10 min). As result, when it completes, the virtual machines are ready.
If the machine is not part of workspace, you will need to choose one of the existing or create new.
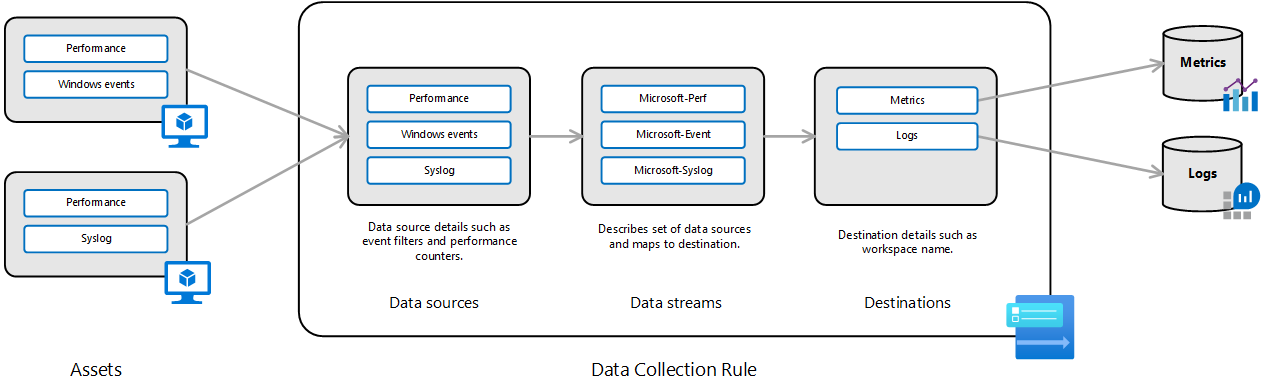
What is Data Collection Rule (DCR)?
Data Collection Rules specify where you write or read the data from (Log Analytics workspace). The rules contain information about:
- Data sources: Unique source of monitoring data with its own format (i.e. Windows event Log, Syslog, Performance counters, etc)
- Streams: Transformation and data type mapping process
- Destinations: Where do we send the data (i.e. Log Analytics, Monitor Metric, Event Hub, etc)
- Data flow: Defines where to send the streams of data
More info: Data collection rules overview
Configure monitoring
Once enabled, if we want to see the status, or modify the configuration, we can do it trough the Azure Portal. Configuration options are rather basic, and boil down Enabled, Disabled or Same as Parent.
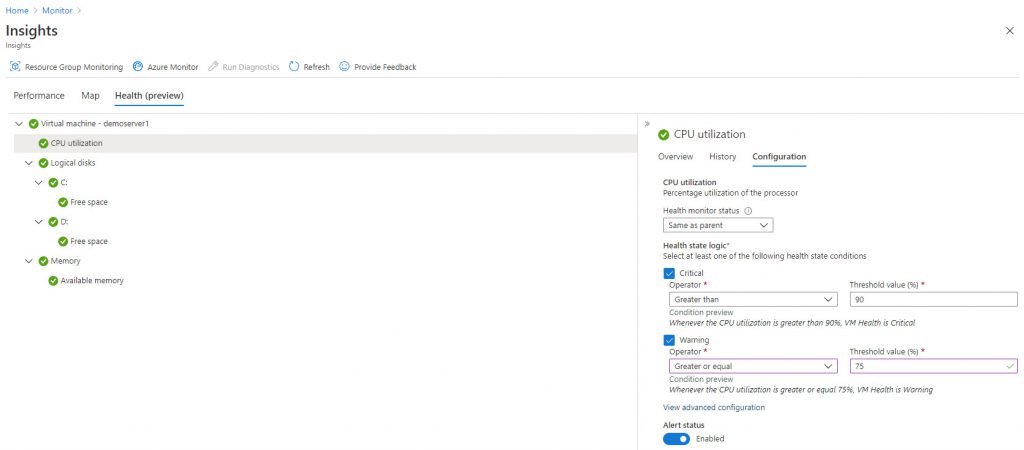
In case of CPU, additional options are setting thresholds for alerting. We define the health state logic with two types of thresholds: Critical and Warning.
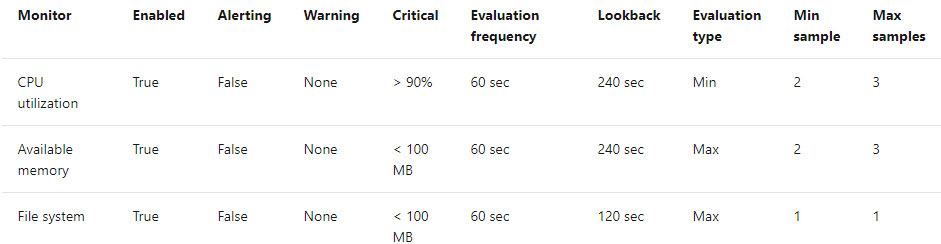
The service uses predefined configuration, for each monitor type – CPU utilization, Logical Disk space, and Memory.
By creating overrides, in the Data Collection Rule (healthRulesOverride element), we can modify default configuration.
For example, the collection rule (JSON) sample shown, will modify the CPU utilization rule to look-back every 120 seconds. It will take minimum 2, maximum 4 samples, with frequency of 30 sec. When average CPU utilization hits 66% or more, the rule executes. It will send warning alert only.
"healthRuleOverrides": [
    {
        "scopes": [
/subscriptions/00000000-0000-0000-0000-000000000000/resourceGroups/demolab-ITuziast.com],
        "monitors": [ "cpu-utilization" ],
        "monitorConfiguration": {
	"evaluationType" : "avg",
        "lookbackSecs": 120,
        "evaluationFrequencySecs": 30,
        "minSamples": 2,
        "maxSamples": 4,
        "warningCondition": {
	 "isEnabled": true,
	 "operator": ">=",
	 "treshold": 66
	  },
        "criticalCondition": {  }
    },
        "alertConfiguration": {  },
        "isEnabled": true
    }
]
More info: Data collection rule customization
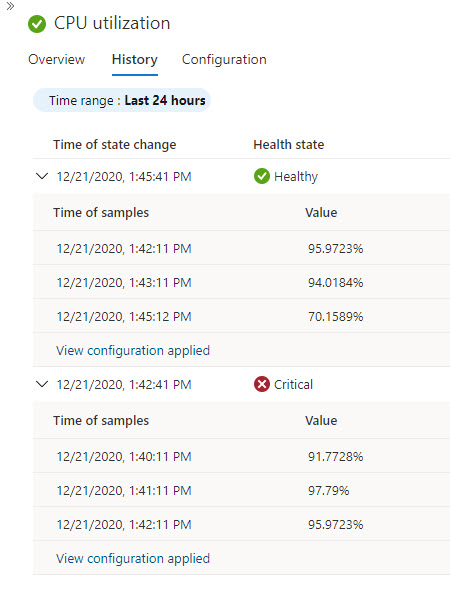
If You need to review the health history, including overview of the applied configuration, use the next blade (History).
Conclusion
Since monitoring is imperative for our infrastructure, this service provides simplified experience to keep an eye on the overall health of your virtual machines. The focus is on three basic, but important parameters, and it has integrated method of alerting.
All the data is available for analysis with queries and workbooks. Just look for HealthStateChangeEvent table in the Log analytics workspace.
As for the costs of the service, at time being (Public Preview) its free. The cost of storing the data in Log Analytics (ingestion and storage) exists.


Be the first to comment