
Connection Monitor is a component of Azure Network Watcher. In the current Preview, it enhances the functionality by embedding Network Performance Monitor (NPM) feature into the Connection Monitor service.
More info: https://docs.microsoft.com/en-us/azure/network-watcher/connection-monitor-preview
What is Network Watcher?
Network Watcher represents set of tools that help Network Administrators to monitor, diagnose, and review metrics in an Azure Virtual Network. The service works with Infrastructure services (IaaS), such as Virtual Machines, Network Virtual Appliances (NVA), Virtual Networks and inter-network connectivity (VPN, ExpressRoute), Application Gateway, Load Balancer. The solution is part of the Azure Monitor service, specifically Log Analytics.
Four core functionalities are:
- Monitoring
- Diagnostics
- Metrics
- Log analysis
Connection Monitor (in Preview)
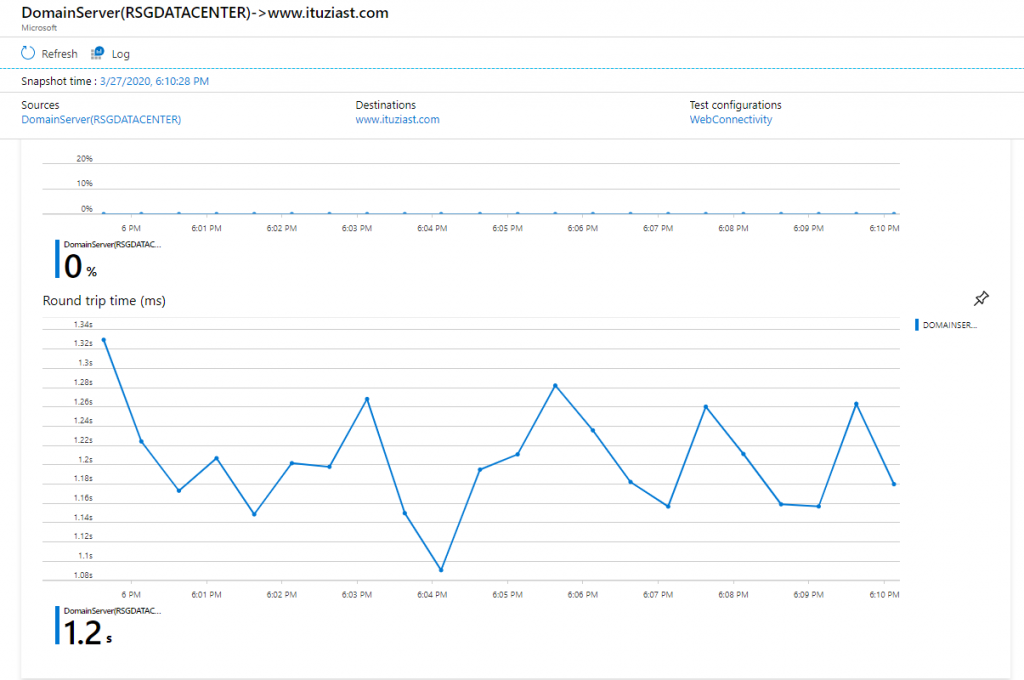
The Connection Monitor performs overview of communication between a virtual machine and specific endpoint. The endpoint can be another virtual machine, a fully qualified domain name (FQDN), a uniform resource identifier (URI), or IPv4 address. It performs the test in regular interval, and then presents the information about reachability, latency, performance (graph), and provides simple network topology diagram (cloud, on-premises, hybrid)
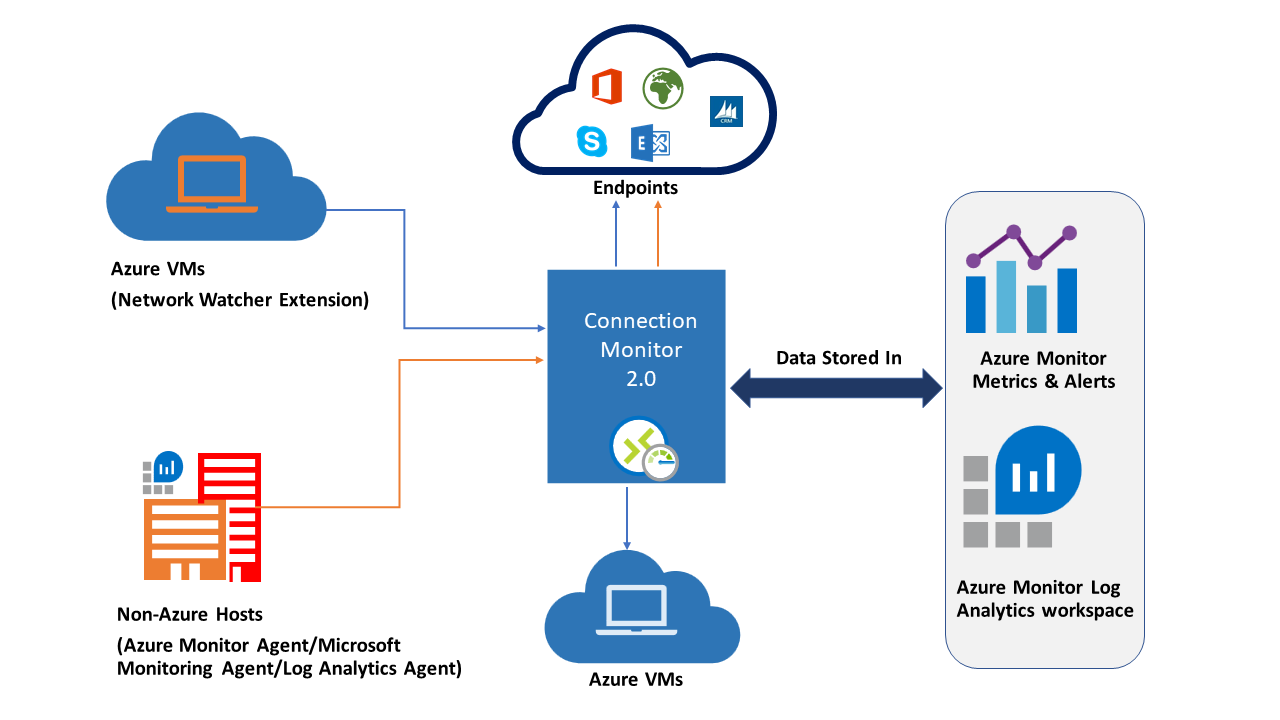
Network Performance monitoring, on other hand, represents a hybrid network monitoring solution, capable of analyzing the performance of various endpoints. It is capable of detecting various network infrastructure issues, such as traffic black-holing, routing errors, link threshold issues, performance issues on network segment or device. This an be done for cloud only, on-premises or hybrid services connectivity.
Benefits
The Preview services combines two features – Connection Monitor and Network Performance Monitor, thus providing the following benefits:
- Single pane of view for all monitoring needs for Azure and/or hybrid deployments
- End-to-end connectivity monitoring across networks in different regions/locations
- Improved probing speed and data quality
- Improved alerting mechanism
- Multiple connectivity check types (HTTP, TCP, ICMP)
- Metrics and Log analytic support for all scenarios (Azure, Hybrid non-Azure)
Prerequisites
In order for You to successfully create the connection monitor, the prerequisites are:
- Network Watcher is enabled on the Subscription
- Monitoring Agents are installed (Netwotk Watcher Extension)
- Network Security is setup to allow ICMP or TCP packet traffic between the monitored nodes/locations (NVA, NSG, embedded firewall, or IPS software)
Creating a connection monitor
They have redesigned the wizard, and I must add in very positive way. after you go trough the “generic” first step, which is Connection Monitor Name, Subscription, Region, You need to fill in the Workspace configuration.
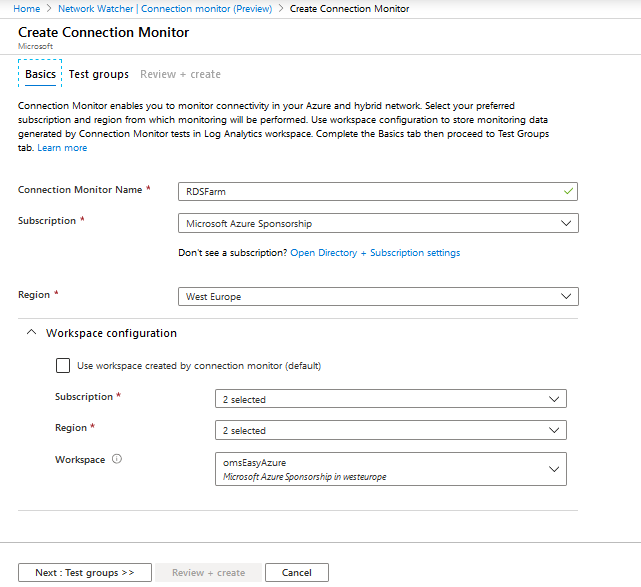
You might opt-out to the default one – created by the deployment itself, and proceed to the next step Add test group details. Another option would be assigning it to existing Workspace, by providing Subscription, Region, and Workspace information
Test Groups
Test group represents logical group of services on which You run the tests (Source and Destination pair, and the test configuration). Within the Connection Monitor, You can have multiple test groups.
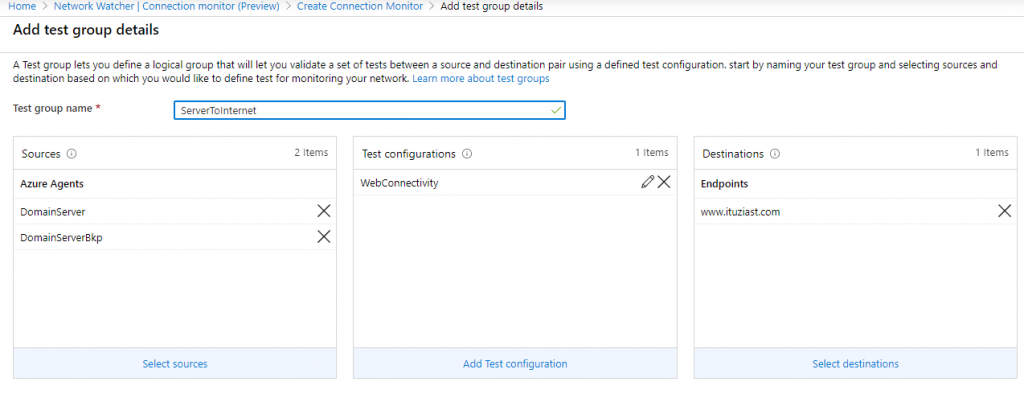
To can still add multiple sources, destinations and test configuration to the same Tet Group. this will help You create groups based on type of service or type of test configuration, and group them together.
After the deployment, it might take some time (~5 min) to get some monitoring data in, and get it presented on the dashboard. Once it does, it provides adequate visibility of the status (Fail, Warning, Indeterminate, Not Running, Pass)
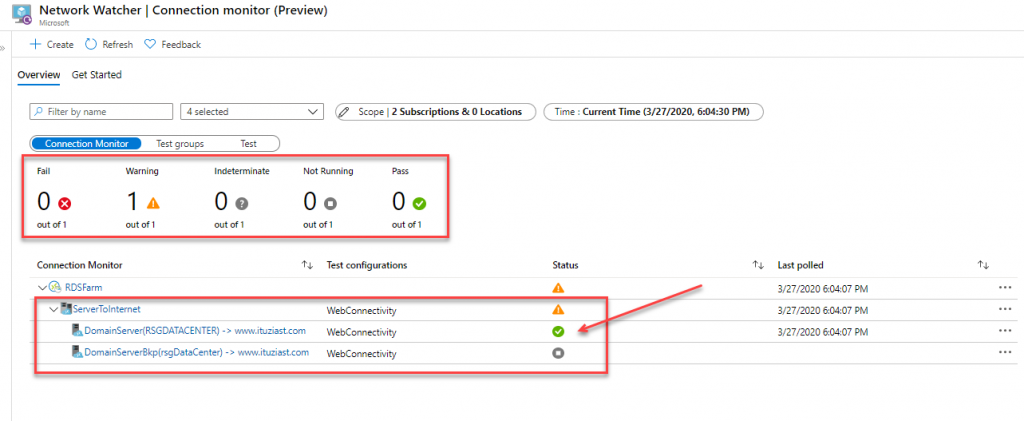
Switching between Connection Monitor, Test Groups, and Test will give You different views on the performed actions, as well as status. Double clicking on item, will pop up the detailed view screen. Now, the visibility of data there is something to work on. The screen was to large, I had to scroll around to get better view of the information, and graphs. Tried it in Firefox and Edge (Chromium), same thing. But, its still in Preview, so I expect this to be fixed till final release.
Use Cases
Thee service can potentially be used in the following scenarios (not limited to them only);
- Checking network connectivity in multi-tiered applications (front tier, middle tier, data tier) – mitigating issues with poor configuration or configuration changes, performance issues, connectivity issues.
- Latency test between network that reside in different cloud regions or on-premises – optimizing resource/service placement, check of the latency status in service access
- Connectivity checks between cloud-to-cloud, cloud-to-onprem virtual machines (office sites, hybrid applications etc)


Be the first to comment