The Azure Monitor for Virtual Machines (VMs), as of this week, is out of Preview. The refreshed service enables in-depth view of the performance trends and dependencies, on a single VM or Virtual Machine Scale Set (VMSS) based on Windows and/or Linux. It brings updated reporting, improved visualization, maping of VM dependencies (applications, ports, communication), as well as discover bottlenecks based on resource utilization, connection metrics, performance trends, and alerts.
More info: https://azure.microsoft.com/en-us/blog/announcing-the-general-availability-of-azure-monitor-for-virtual-machines
What is Azure Monitor for Virtual Machine?
In essence the service has existed from the start, but it has been refurbished and improved in several areas. All existing systems, already attached to Azure Monitor, to continue using it, You need to upgrade the Agent to the latest version. This is rather straight forward process, that can be done by using the Portal or PowerShell/CLI.
For all new deployments, you need to create a Log analytics Workplace first, and then assign the VM You want to monitor to it. Have in mind that You can monitor Azure, but also on-premises workload, and 3rd party cloud deployments, as well. We will discuss specific on Log analytics and Azure Monitor in different article.
Insights
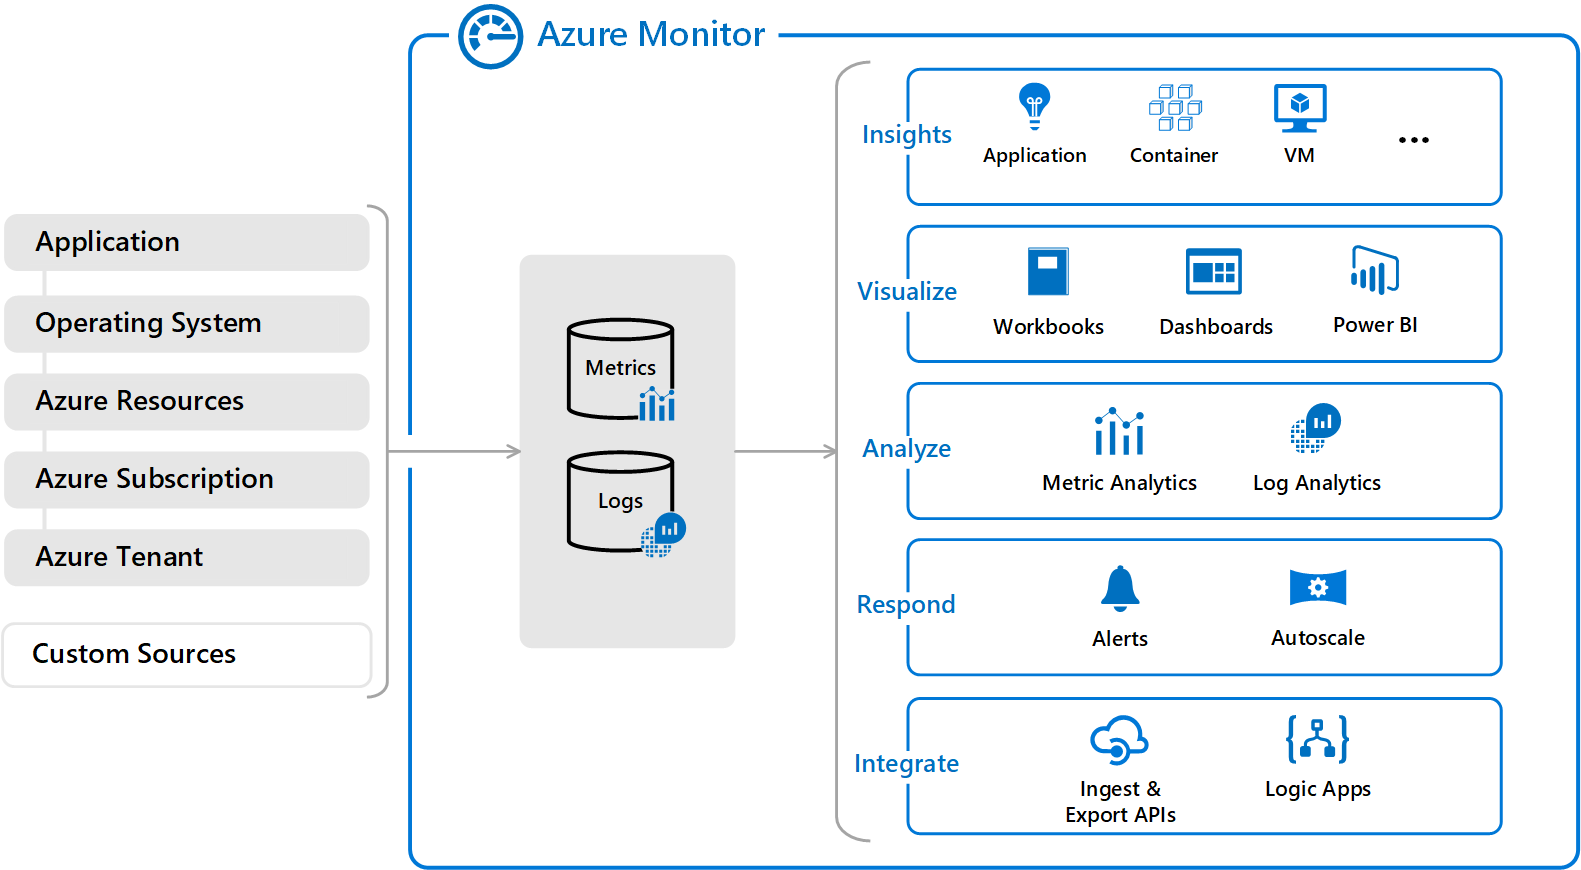
Azure Monitor includes several features and tools that provide useful visibility and insights into the operations of Your environment (computing, applications) and other resources that they depend on. The solutions are:
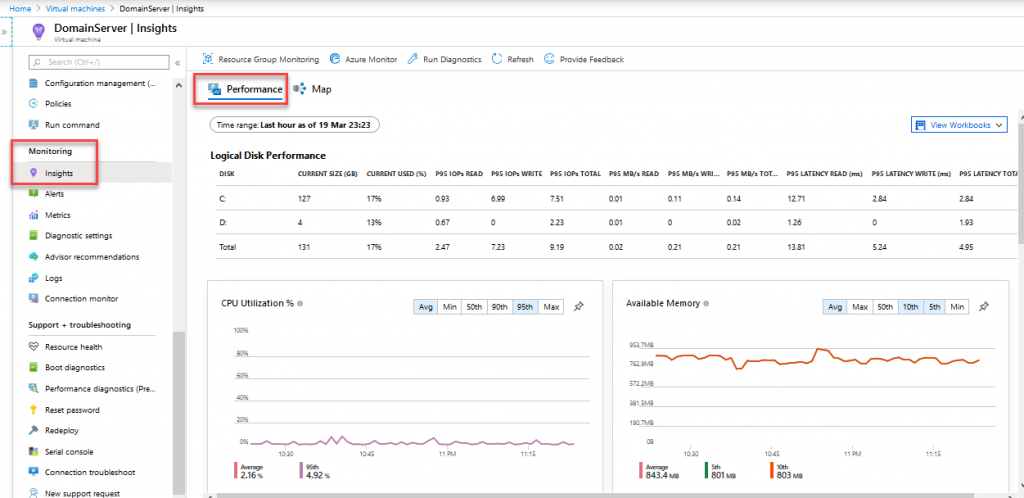
- Azure Monitor for Virtual Machines – monitors the IaaS environment (Virtual Machines, Virtual Machines Scale Sets), and collects performance and health information, regardless of the OS (Windows, Linux). It also maps the dependencies between the OS, Applications and other external resources (Service Map)
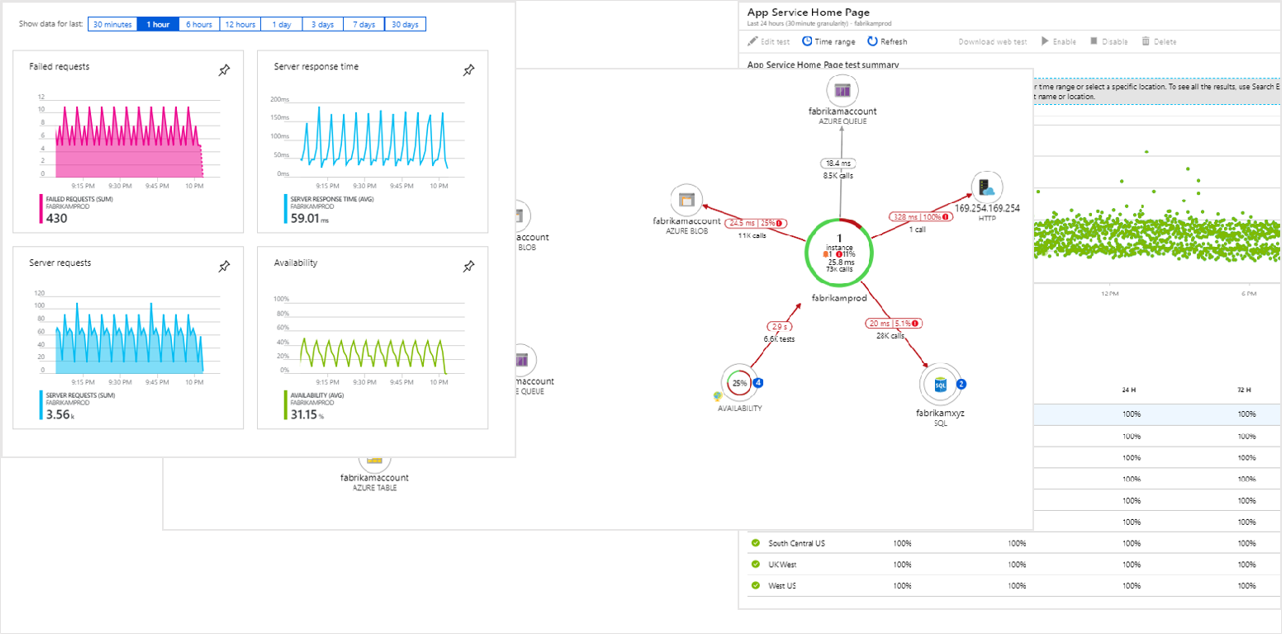
- Application Insights – monitors the availability, performance, and usage of your web applications (Azure, On-premises). It still relies on the Azure Monitor service, deeply integrated with the app environment (operations and diagnostic errors), automating the process of data collection. In addition to that, includes data connection point with variety of DevOps tools.
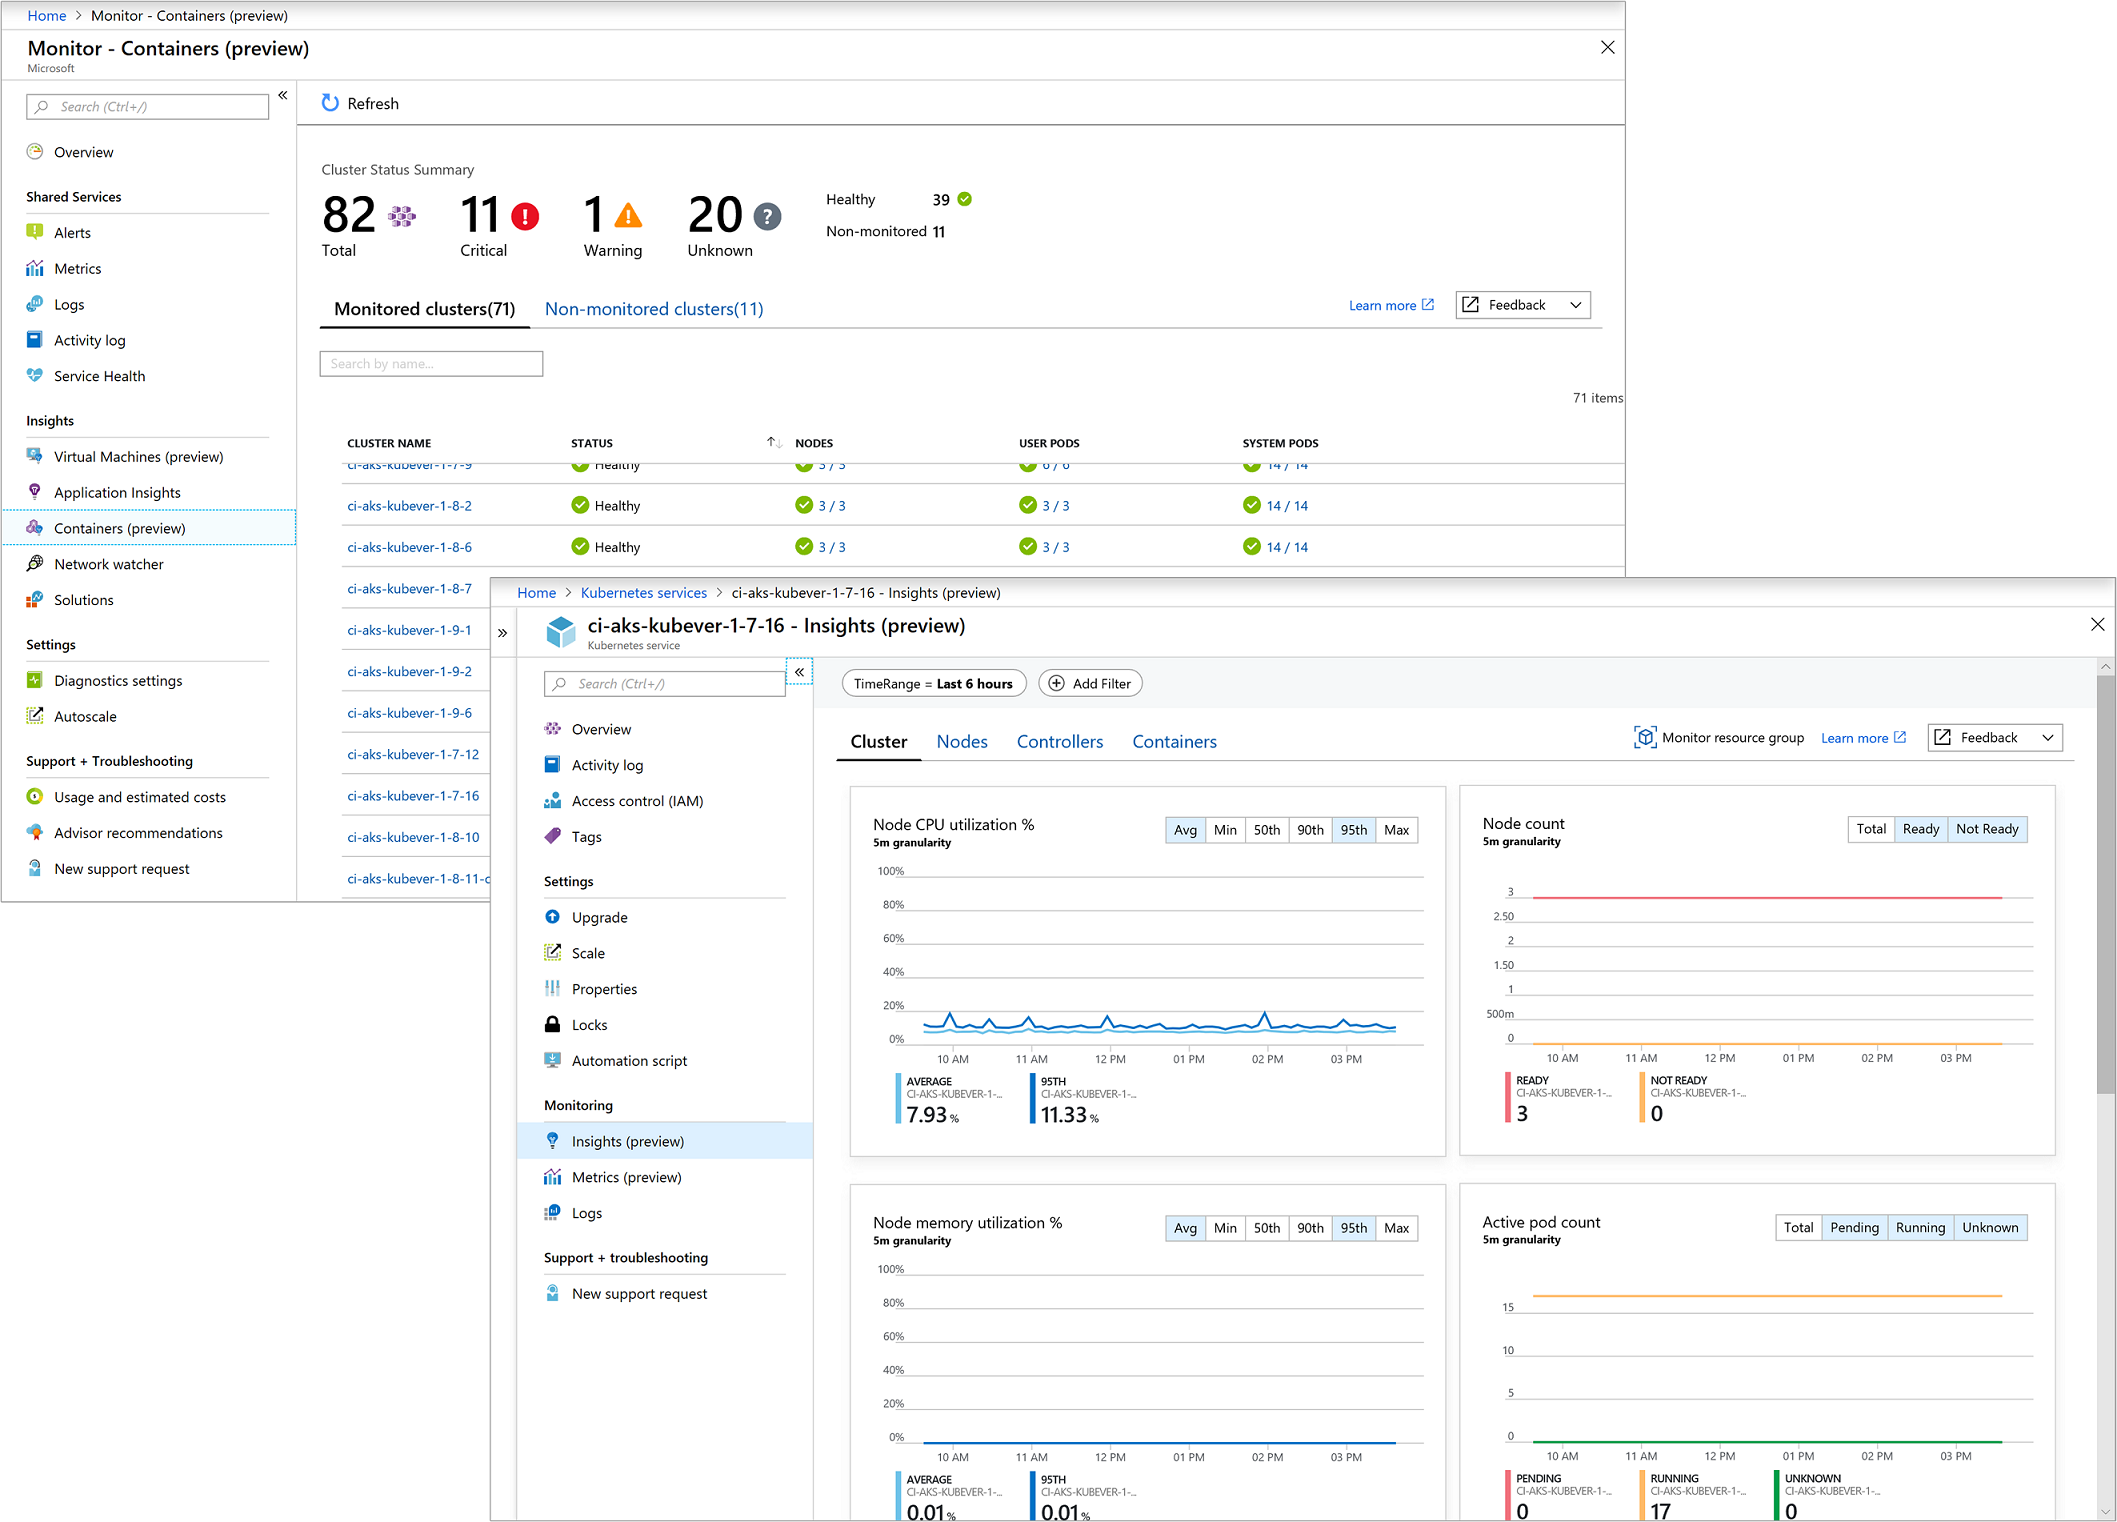
- Azure Monitor for containers – monitors the performance of container workloads deployed to Azure Kubernetes Service (AKS). It provides collection and visibility of performance data on the controllers, nodes, and containers (memory and processor metrics), collects container logs, by means of Analytics Agent for Linux (containerized).
Features
Azure Monitor includes several features that enable ease of data usage, analysis, visualization, and alerting mechanisms. Main features of the service include:
- Dashboards – single pane of view of all metric and/or log data in one place. There can be multiple Dashboard defined on various data sets, and access to them provided to relevant people (they can be shared)
- Data export and integration – the service enables tight integration with PowerBI, but also supports integration with other services. Besides the APIs, that enable custom solution integration, there is native support for Event Hub, and Logic Apps
- Monitoring Solutions – packaged sets of logic that provide insights for a particular application or service. The data is represented by means of series of queries (Kusto Query Language), run on the data sets and presented on dashboards. They are provided by Microsoft or Partners
- Workbooks – provide a flexible and easy way for data analysis and the creation of rich visual reports. Workbooks has the ability to combine data from various sources within a single report, and enabling rich data visualization capabilities
- Alerts – proactively notify you of critical conditions and potentially attempt to take corrective action. They can be based on metrics, thus action will provide near real time alerting based on numeric values, and based on logs, that allow executing complex actions, based on logic across data from multiple sources. Actions can range from basic alerting (i.e. sending emails), to executing automation tasks, streaming the data to external service (Event Hub, Logic App, ITSM tools).


Be the first to comment