
In Preview, but this is a fully managed load-testing service. Its meant to simulate traffic to applications, regardless where the hosting is. As a result of that, Developers, Testers and/or QA engineering teams can optimize application performance, scalability, or capacity.
The service is based on Apache JMeter. Combined with continuous integration and deployment (CI/CD) workflows, it represents a powerful tool for automated regression testing.
How does it work?
Azure Load Testing uses Apache JMeter version 5.4.1 for running load tests. You can use Apache JMeter plugins in your test script.
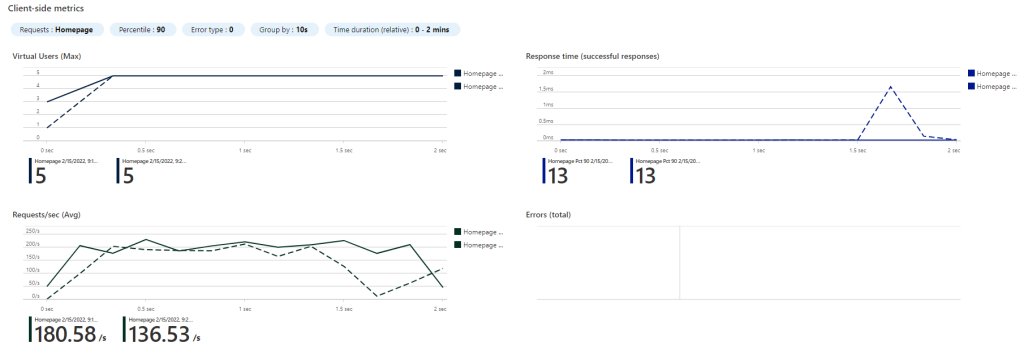
Hosting of the application can be anywhere (cloud, on-prem). During the test, the application will collect client and server side metrics. The dashboard shows the data and specific details.
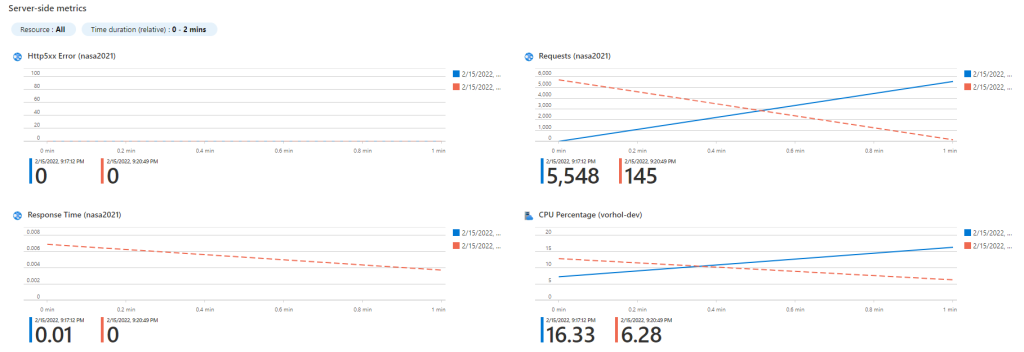
Client-side metrics will show information such as number of virtual users, the request response time, or the number of requests per second. On the server-side, different metrics are available (number of database reads, the type of HTTP responses, or container resource consumption, etc). In other words, depending on the type of service, adequate metrics can be selected.
The service integrates with Application Insights and Container Insights trough Azure Monitor. In addition, Azure Load Testing, automatically incorporates best practices for Azure networking. This help make sure that Your tests run securely and reliably. Tests will automatically stop if the application endpoint or Azure components start throttling requests.

Load testing automation is available trough integration with CI/CD pipeline (Azure Pipelines, GitHub Actions). This helps You validate release candidate builds at the end of each sprint (automated testing).
Create and run load tests
First, you need to create the top-level resource for Azure Load testing.

Once resource is created, You can proceed to creating test plans, for which appropriate access permissions need to be assigned.
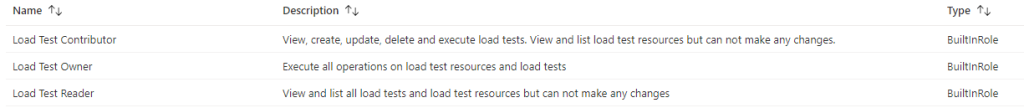
Therefor, with Load Test Contributor or Load Test Owner roles You can manage the Test plans in the portal.
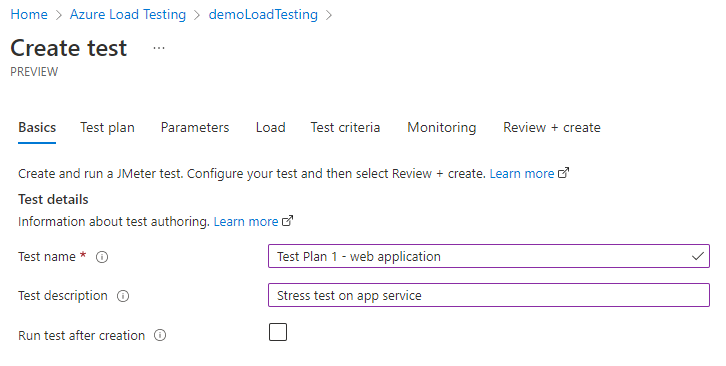
Firstly, you fill in the Basic information about the test. Secondly, you can proceed to uploading the JMeter script (jmx file). Uploading data and/or configuration files is optional.
For instance, we will do a short load test on demo web site. The test will emulate 5 simultaneous virtual users and run for 2 minutes.
<?xml version="1.0" encoding="UTF-8"?>
<jmeterTestPlan version="1.2" properties="5.0" jmeter="5.4.1">
  <hashTree>
    <TestPlan guiclass="TestPlanGui" testclass="TestPlan" testname="Test Plan 1 - web application load test" enabled="true">
      <stringProp name="TestPlan.comments"></stringProp>
      <boolProp name="TestPlan.functional_mode">false</boolProp>
      <boolProp name="TestPlan.tearDown_on_shutdown">true</boolProp>
      <boolProp name="TestPlan.serialize_threadgroups">false</boolProp>
      <elementProp name="TestPlan.user_defined_variables" elementType="Arguments" guiclass="ArgumentsPanel" testclass="Arguments" testname="User Defined Variables" enabled="true">
        <collectionProp name="Arguments.arguments"/>
      </elementProp>
      <stringProp name="TestPlan.user_define_classpath"></stringProp>
    </TestPlan>
    <hashTree>
      <ThreadGroup guiclass="ThreadGroupGui" testclass="ThreadGroup" testname="Thread Group" enabled="true">
        <stringProp name="ThreadGroup.on_sample_error">continue</stringProp>
        <elementProp name="ThreadGroup.main_controller" elementType="LoopController" guiclass="LoopControlPanel" testclass="LoopController" testname="Loop Controller" enabled="true">
          <boolProp name="LoopController.continue_forever">false</boolProp>
          <intProp name="LoopController.loops">-1</intProp>
        </elementProp>
        <stringProp name="ThreadGroup.num_threads">5</stringProp>
        <stringProp name="ThreadGroup.ramp_time">10</stringProp>
        <boolProp name="ThreadGroup.scheduler">true</boolProp>
        <stringProp name="ThreadGroup.duration">120</stringProp>
        <stringProp name="ThreadGroup.delay">5</stringProp>
        <boolProp name="ThreadGroup.same_user_on_next_iteration">true</boolProp>
      </ThreadGroup>
      <hashTree>
        <HTTPSamplerProxy guiclass="HttpTestSampleGui" testclass="HTTPSamplerProxy" testname="Homepage" enabled="true">
          <elementProp name="HTTPsampler.Arguments" elementType="Arguments" guiclass="HTTPArgumentsPanel" testclass="Arguments" testname="User Defined Variables" enabled="true">
            <collectionProp name="Arguments.arguments"/>
          </elementProp>
          <stringProp name="HTTPSampler.domain">nasa2021.mk</stringProp>
          <stringProp name="HTTPSampler.port"></stringProp>
          <stringProp name="HTTPSampler.protocol"></stringProp>
          <stringProp name="HTTPSampler.contentEncoding"></stringProp>
          <stringProp name="HTTPSampler.path"></stringProp>
          <stringProp name="HTTPSampler.method">GET</stringProp>
          <boolProp name="HTTPSampler.follow_redirects">true</boolProp>
          <boolProp name="HTTPSampler.auto_redirects">false</boolProp>
          <boolProp name="HTTPSampler.use_keepalive">true</boolProp>
          <boolProp name="HTTPSampler.DO_MULTIPART_POST">false</boolProp>
          <stringProp name="HTTPSampler.embedded_url_re"></stringProp>
          <stringProp name="HTTPSampler.connect_timeout"></stringProp>
          <stringProp name="HTTPSampler.response_timeout"></stringProp>
        </HTTPSamplerProxy>
        <hashTree/>
      </hashTree>
    </hashTree>
  </hashTree>
</jmeterTestPlan>
You can configure (Parameters Blade) either Environment variables and/or Secrets. They are:
- Non-sensitive parameters exposed as environment variables for access by the load test engine at runtime.
- Sensitive parameters (Secrets) required for running the load test.
These parameters are passed to the load test engine securely and are not exposed. We recommended storing the secrets in Azure Key Vault. As a result, the secret identifier is provided as the value.
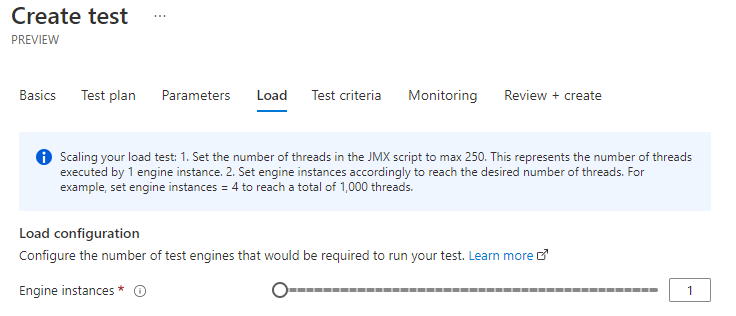
Load configuration defines the number of test engines that would be required to run the test. This supports the scaling needs of the test.
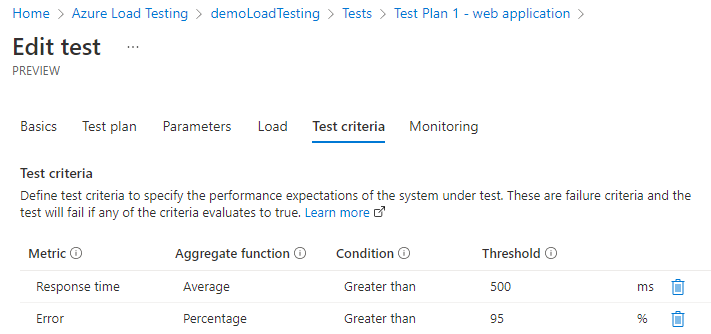
By defining test criteria, you can specify the performance expectations of your application under test. Most importantly, You can define a maximum of 10 test criteria for a load test. In short, if there is more than one, lowest threshold value wins.
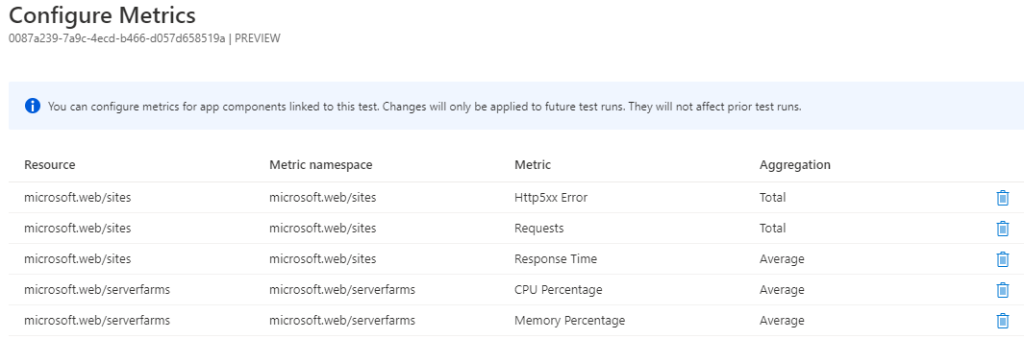
Final step before running is the server-side components that are part of the application. Further, based on selected components, You can then configure the metrics for each one.
Updated list of components is here: link.
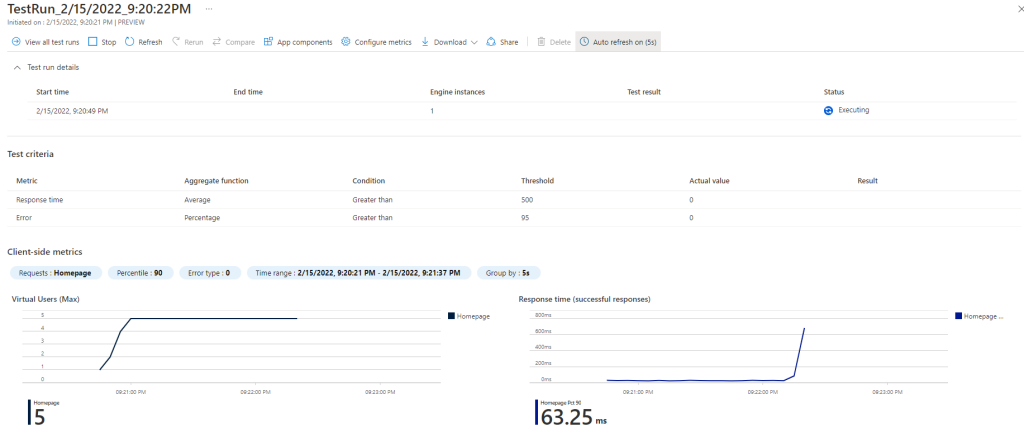
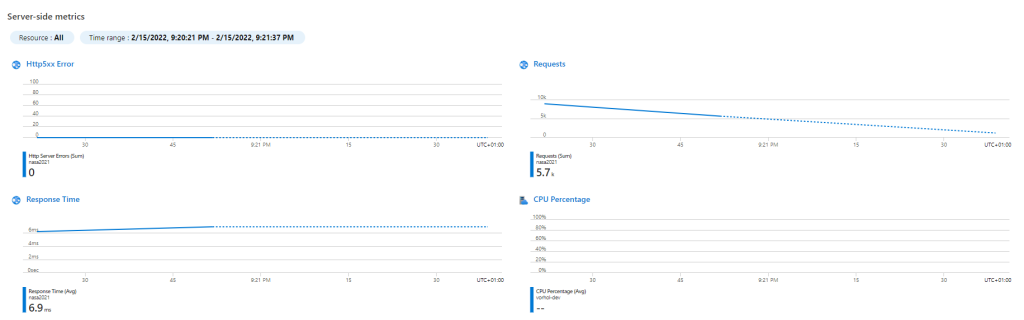
Therefore, the test will provide information on the client-side and server-side metrics. Secondly, You can configure server-side metrics as well.
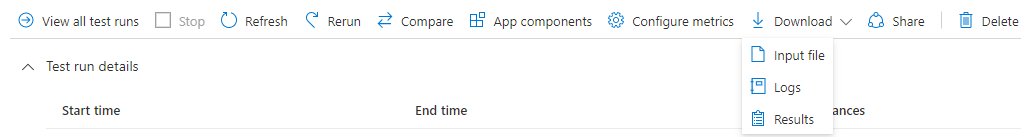
Once you finish the test, results will be displayed instantly. We can Re-run or Compare the test. Furthermore, we can modify the linked components, or the initial configuration of the test itself. If needed, we can download the input file, logs, or results.
As a result, test run contains client-side and server-side metrics, by overlaying multiple metrics charts, you can more easily pinpoint performance changes and identify which application component is causing problems.
You can choose a maximum of five test runs to compare. For each ‘Load Testing Resource’, there is monthly fee, and You have access to the included 50 VUH.
A Virtual User Hour = (# of virtual users simulated * the duration the simulation in minutes) / 60 minutes per hour. They count number of active virtual users every 10 seconds. Then, You are charged for the equivalent number of fractional Virtual User Hours used.
Example: For instance, simulating 1,000 virtual users, for 30 minutes, the charge is 500 virtual user hours.
Conclusion
Its more than it meets the eye, and what this article covers. Above mentioned features and capabilities are scratching the surface. Bottom line is that Azure Load Testing is here to help you integrate load testing into your continuous integration and continuous delivery (CI/CD) workflows. This helps You find performance issues before they happen in production.
Keep an eye on the service, start using it. Further more, pricing information is already published. That is to say, so as soon as it gets out of preview You are good to go in production. Check out the links at the end for more information.
Getting started
“Introducing Azure Load Testing: Optimize app performance at scale” by Mandy Whaley Partner Director of Product, Azure Dev Tools
Azure Load Testing documentation
Quickstart: Create and run a load test with Azure Load Testing Preview
Tutorial: Identify performance regressions with Azure Load Testing Preview and GitHub Actions


Be the first to comment